
At its essence, science is rooted in human curiosity: asking questions, challenging assumptions, and discovering truth in spite of our preconceived ideas. In the words of the acclaimed author and scientist Carl Sagan:
“Science invites us to let the facts in, even when they don’t conform to our preconceptions. It counsels us to carry alternative hypotheses in our heads and see which best fit the facts. It urges on us a delicate balance between no-holds-barred openness to new ideas, however heretical, and the most rigorous skeptical scrutiny of everything — new ideas and established wisdom.”
For scientists in academia, industry, and research institutions, the steps of the scientific process outlined below provide a structure for exploring research interests. If you have a basic understanding of these steps, the layout and structure of published research will make a lot more sense.
The steps that make up the scientific process or method are as follows:
- Ask a Question: Beginning with curiosity and observation, the researcher frames a question.
- Do Basic Research: Based on the question, the researcher reviews existing literature and performs initial experiments. The researcher must determine if the question has already been tested and if so, what the results were. Were there areas that were suggested for further explanation? The question to be explored MUST be put in context of the existing body of knowledge, and if the question still seems novel, the researcher moves to the next step.
- Form Hypothesis: Based on the preliminary conclusions drawn from existing research and experiments, a hypothesis or an explanation is proposed. Note: A critical element of a hypothesis is that it is possible for an experiment or evidence to prove that it is incorrect. It does not rely on faith.
- Experiment: Conduct research and test against the hypothesis.
- Analyze Results: Evaluate the findings from the experiments and refine the hypothesis in light of the findings. The process may be repeated a number of times and may require the researcher to go back and modify the original hypothesis.
- Publish Findings: Assuming that the hypothesis isn’t proven incorrect, the researcher typically creates a report that documents the findings in such a way that others are able to replicate and validate the results.
Key Terms and Concepts in Scientific Research
Basic Statistics
“There are three kinds of lies: lies, damned lies, and statistics” – Mark Twain and Benjamin Disraeli
In order to read and comprehend scientific research, you must have a basic understanding of statistics. If you have never taken a collegiate level statistics course, here are links to two excellent tutorials to get you started:
The data that a researcher gathers typically represents a small sample of a given group, but by using appropriate statistical techniques, the researcher is able to estimate if and how the data relates to the larger population.
A few key statistical terms that you will see in every study you read are as follows:
Sample Size: The number of a group being studied. Researchers typically want to find a sample size large enough so that they can draw statistically significant conclusions from their data.
Confidence Interval: A confidence interval is an estimated range of values representing the sample data that likely contains the actual value found in the broader population. It is expressed in terms of a confidence level (typically 95% or 99%) which suggests that the true value would be found within the confidence interval 95% or 99% of the time.
P Value: An expression of the confidence level. p=.05 would be a 95% confidence level while p=.01 would be a 99% confidence level.
Statistically Significant: Statistically significant does not refer the the importance or gravity of a particular conclusion, but rather it implies whether or not a conclusion could have been a result of chance.
Correlation and Causation: Correlation is defined as a statistical relationship between two random variables while causation means that one thing causes another. For example, it is true that the presence of a fire truck might be highly correlated with house fires; however we know that fire trucks do not cause house fires. As obvious as that example is, it is easy to read a research report and leap to a conclusion that one thing causes something else to happen. As you read, be mindful of phrases like “linked to,” “a relationship between,” or “associated with.” They imply correlation and not causation.
Definitions
Blind: Not given complete information to a group involved in a study, as the knowledge from that information might somehow bias behavior.
Cohort: A group of people who share a common characteristic.
Control: A group that does not receive the experimental treatment. The results from this group are compared against the results from the experimental group that does receive the treatment.
Double-blind: A valuable research study protocol where neither the researchers nor the subjects know whether they belong to the experimental group or the control group.
Placebo: A medically ineffective treatment which in some cases is known to provide a perceived effect by the person receiving the treatment. This is called the “placebo effect.” In some experiments, a placebo is given to the control group in order to show the true efficacy of the treatment being studied.
Randomized Trials: A study in which participants are arbitrarily or randomly assigned to be a part of the group getting treatment or part of the “control group.” A control group may get a placebo, a different dosage of the treatment, or another appropriate treatment that is well understood.
“Science is organized common sense where many a beautiful theory is killed by an ugly fact.” -Thomas Huxley
Additional Information about Correlation and Causation
If you are struggling with the concepts of correlation and causation, the follow two references may be helpful:
- The Dihydrogen Monoxide Research Division which looks at the “risks” of Dihydrogen Monoxide, otherwise known as water.
- The Smell of Bakery Bread May be a Health Hazard, a humorous look at how bread might be a menace to society.
Components of a Research Report
The six components of a research report are as follows: An abstract, introduction, methodology, results, discussion, and references.
The Abstract
The abstract is an overview of the research study and is typically two to four paragraphs in length. Think of it as an executive summary that distills the key elements of the remaining sections into a few sentences.
An abstract will look similar to the following:
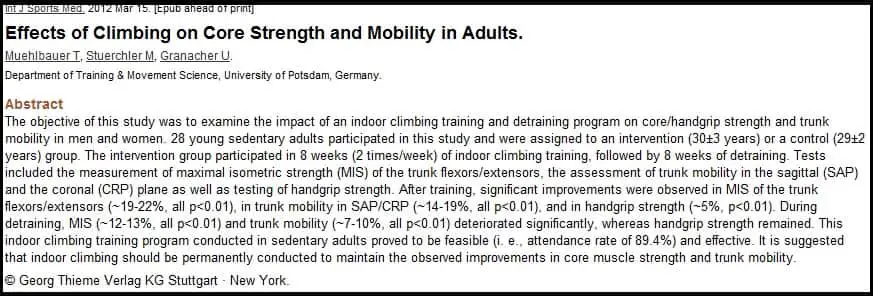
In many cases, you can determine what is interesting about a study by analyzing the abstract (see article by Noah Gray in The Huffington Post).
Introduction
The introduction provides the key question that the researcher is attempting to answer and a review of any literature that is relevant. In addition, the researcher will provide a rationale for why the research is important and will present a hypothesis that attempts to answer the key question. Lastly, the introduction should summarize the state of the key question following the completion of the research. For example, are there any important issues or questions still open?
Methodology
The methodology section of the research report is arguably the most important for two reasons. First it allows readers to evaluate the quality of the research and second, it provides the details by which another researcher may replicate and validate the findings. (1)
Typically the information in the methodology section is arranged in chronological order with the most important information at the top of each section. (2)
Ideally the description of the methodology doesn’t force you to refer to other documents; however if the author is relying on existing methods, they will be referenced.
Results
In longer research papers, the results section contains the data and perhaps a short introduction. Typically the interpretation of the data and the analysis is reserved for the discussion section.
Discussion
The discussion section is where the results of the study are interpreted and evaluated against the existing body or research literature. In addition, should there be any anomalies found in the results, this is where the authors will point them out. Lastly the discussion section will attempt to connect the results to the bigger picture and show how the results might be applied.
References
This section provides a list of each author and paper cited in the research report. Any fact, idea, or direct quotation used in the report should be cited and referenced.
Types of Research Studies
Research can be classified into two categories: Basic research, which is done in a lab or a clinical setting and applied research, which is done with real subjects in real-world situations. And from these categories of research, we have the following general types of studies:
Animal Study: An animal or in vivo study is a study in which animals are used as subjects. A common use of an animal study is with a clinical trial (see below) and as a precursor to evaluating a medical intervention on humans. However, it is critical to recognize that results from animal studies should not be extrapolated to draw conclusions on what WILL happen in humans.
Case Study: A case study provides significant and detailed information about a single participant or a small group of participants. “Case studies are often referred to interchangeably with ethnography, field study, and participant observation.” (3) Unlike other studies which rely heavily on statistical analysis, the case study is often undertaken to identify areas for additional research and exploration.
Clinical Trial Study: A clinical trial study is often used in the areas of health and medical treatments that will presumably yield a positive effect. Typically a small group of people or animals are selected based upon the presence of a specific medical condition. This group is used to evaluate the effectiveness of a new medication or treatment, differing dosages, new applications of existing treatments. Due to the risk involved with many new medical treatments, the initial subjects in a clinical trial may be animals and not humans. After positive outcomes are obtained, research then can proceed to a human study where the treatment is compared against results from the existing standard of care.
Correlational Study: Correlational studies evaluate the relationship between variables and determine if there is a positive correlation, a negative correlation, or no correlation. Please note, a positive correlation does not mean one thing causes another. Correlational studies are typically used in naturalistic observations, surveys, and with archival research. (4)
Cross-sectional Survey: Also know as the synchronic study, a cross-sectional survey collects data at a single point in time but the questions asked of a participant may be about current and past experiences. They are often done to evaluate some aspect of public health policy.
Epidemiological Study: Epidemiological studies evaluate the factors and associations linked to diseases. Types of epidemiological studies include case series studies, case control studies, cohort studies, longitudinal studies, and outbreak investigations.
Epidemiological studies are often beneficial in identifying areas for a more control research evaluation; however all to often, readers of epidemiological research miscategorize links and associations as causes. In addition, a common problem with epidemiological studies is that they rely on memory recall which can be quite unreliable.
Experimental Study: In an experimental study, specific treatments are applied to a sample or group and the results are observed.
Literature Review: A literature review is an exhaustive search of all of the relevant literature related to a specific research topic.
Longitudinal Study: A specific type of epidemiological study, the longitudinal study follows subjects over a long period of time, asking a specific research question with repeated samples of data gathered across the duration of the study. These studies are often used as the basis for specific experimental studies. For example, the Framingham Heart Study has evaluated people from the town of Framingham, Massachusetts since 1948 looking for patterns in heart disease.
Meta-analysis: A meta-analysis is a statistical process in which the results of multiple studies evaluating a similar research objective are collected and pooled together. They are often used to determine the effectiveness of healthcare interventions and experiments.
Additional Reading: To explore this topic in greater depth, please see The Craft of Research.
Finding Scientific Research Online
Accessing articles and reports published in scientific journals is incredibly simple. If you already know the name of a specific study, simply enter that name into a Google search; however, using Google as a broad match search tool can return results that are of dubious quality.
A much better approach is to use an online database of indexed, peer-reviewed reports. In most, but not all cases, these databases do not contain complete studies but simply provide a summary or abstract and a link to the actual articles. Two excellent databases for finding scientific reports are:
- Pubmed: A database containing over 21 million citations of health and medical studies.
- ERIC – Education Resources Information Center: “The world’s largest library of education literature.”
For the remainder of this article, I will illustrate specific ideas using examples from Pubmed.
Using Keywords
An efficient way to use Pubmed is searching for topical keywords. In the example below, I have typed the first three letters in the word “diabetes” and the search engine suggested a number of keywords that might be relevant.
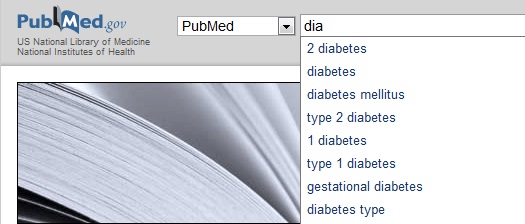
If I complete the query using the broad keyword “diabetes,” I get a list of over 400,000 scientific reports; however if I am more precise and enter “gestational diabetes,” the number of results is a more manageable 9800. After entering a search query, in addition to the list of results, you will see a list of related searches in the right-hand sidebar.
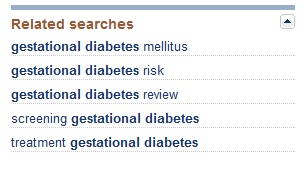
By choosing one of these related searches, you can narrow the results even further. For example, if I select “screening gestational diabetes,” my results are only 3800 citations.
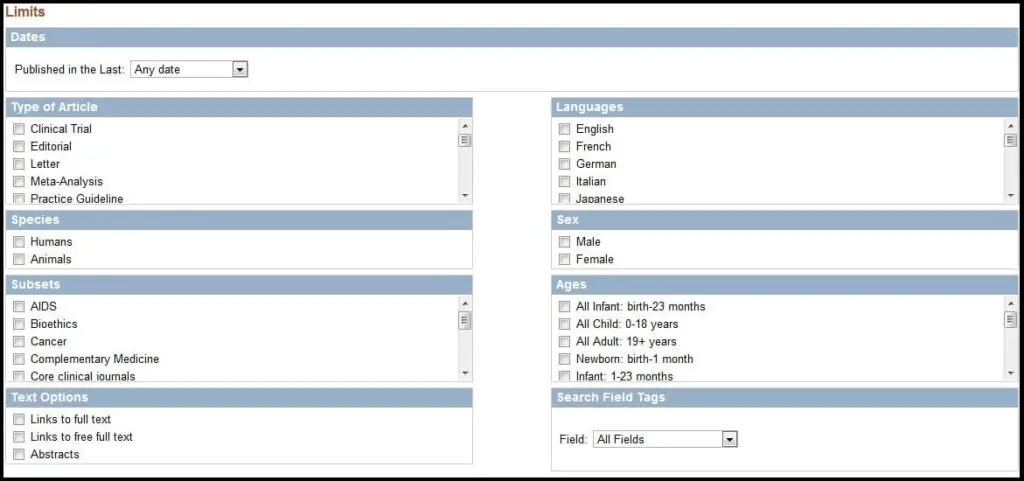
Using the Limits Feature
Perhaps the quickest way to narrow a search is to use the Limits feature. If you click the button as show below,

you will have the ability to filter your query based on approximately 100 parameters.
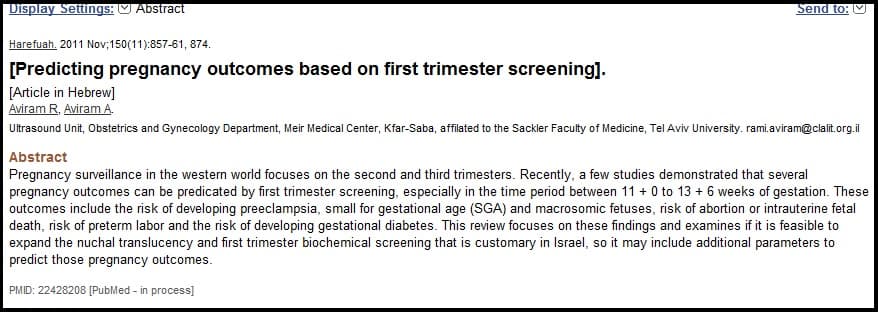
Viewing a Citation
Looking at Related Literature
While viewing an individual citation, you will notice a list of related citations on the right-hand side of the page. This list is generated algorithmically by Pubmed and should contain additional relevant studies.
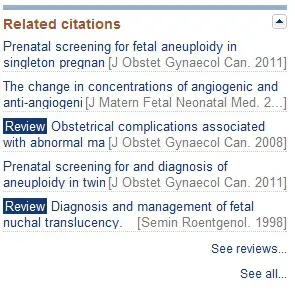
You may also see a link to other articles cited in this study or other papers that reference this study. These citations are likely to be highly relevant and worth evaluating.
And lastly, when viewing a citation, you can click on the names of the study’s authors which will generate a list of additional papers they have authored. These papers are also likely to be relevant to your search as researchers tend to focus on a narrow range of topics.
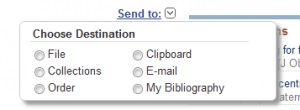
Saving Your Results
After you locate a citation that is relevant, you can easily save the information to a file or by emailing it to yourself. Simply select the “Send to” pull down menu at the top of the screen on the right-hand side.
For more detailed assistance, you can reference this page on Pubmed about saving your results.
Finding a Full-Text Journal Article
In some cases you can access the full text journal article by clicking on the Free Full Text logo linking to Pubmed Central.
In the case of the “screening gestational diabetes” query referenced above, approximately 15% of the journal articles are available for free on Pubmed Central. And finding a free version of the article can be a very big deal as many journals charge $15 to $50 for an individual article.
Additional Pubmed Central Information: Pubmed is the database that contains abstracts and links to published research while Pubmed Central contains over 2 million free full-text journal articles. And a new rule requires that any published research funded by the National Institutes of Health must be made freely available within one year of the initial publication.
I have had success reading, printing, and saving to PDF journal articles using a FREE guest terminal at the library of my local university. A good starting point at the library is at the help desk or reference center.
Another excellent option for locating free research articles is to use an open-access portal like the Public Library of Science, “a nonprofit publisher and advocacy organization leading a transformation in scientific and medical research communication.”
For additional options and ideas for finding full-text scientific reports, check out this page on Pubmed.
Bad Science: Common Problems in Research Articles

The following information is intended to show a few common examples of bad science and/or problems in research – it is not meant exhaustive list nor is it meant to point a wagging finger at scientists. In many if not most cases, problems with studies are a result of interpretation and reporting as opposed to the study itself.
Overgeneralization and Extrapolation of Results: This problem typically occurs when the results of a study from a specific sample are extrapolated to what is believed to be a similar group. An example would be research where a new cholesterol drug was tested on females aged 30-50. Can we, or should we make assumptions on what the drug might do for males or 65 year old women? Absolutely not. Or what about a research study evaluating an after school reading program in New York City. Would the results of this study be applicable in Des Moines, Iowa? Perhaps, but we can not and should not assume that the results would be the same.
Conflict of Interest: You should always look at the conflict of interest statement at the end of a research study as part of your evaluation of potential bias in both study design as well as the data. For example, a recent study compared 1,534 studies involving cancer research. “Studies that had industry funding focused on treatment 62 percent of the time, compared to 36 percent for other studies not funded by industry. And the studies funded by industry focus on epidemiology, prevention, risk factors, screening or diagnostic methods only 20 percent of the time, vs. 47 percent for studies that had declared no industry funding.” – LiveScience.
Absolute vs. Relative Percentages: Suppose that there was a medical problem that caused 2 people in 1,000,000 to have a stroke, and suppose there was a treatment that would reduce the problem to only 1 person per 1,000,000. This would be an improvement of 0.0001% in an absolute sense or NO BIG DEAL. However had I reported the results using relative percentages, I could have stated: “New medical treatment yields a 50% reduction in risk of stroke.” This would obviously be quite misleading, but it is a common practice.
Unpublished Clinical Trials: A study by the Yale School of Medicine found that 50% of clinical trials funded by the National Institutes of Health (NIH) had published their research findings within 30 months of study completion. The problem is also extremely common in research that has been funded by pharmaceutical companies. These unpublished studies may have been withheld to prevent a medical intervention from being shown in a bad light.
This problem of unpublished results is also common in studies with small sample sizes.
And lastly, it is common for researchers to only report results that are statistically significant and thereby leave out data with negative findings. This data would be especially helpful for follow-on research during the literature review process.
Selective Observation: Selective observation is when a researcher is drawn to a particular conclusion based on an existing bias or belief. For example, a researcher that is studying obesity may believe that obese people lack willpower and may construct an experiment that involves a plate of doughnuts in a conference room at work. If that researcher only records data about obese subjects and doesn’t record non-obese subjects, they may have a biased experiment.
Additional Resources
- Bad Science (a book by Ben Goldacre)
- Conflicts of Interest in Research
- The differences in differences problem
- The Truth Wears Off – From The New Yorker
Contributors and Reviewers
Thanks to Nick Kim at Nearing Zero for permitting the use of all cartoons not identified as Vadlo.com.
- Dr. Stephen Gangemi Chiropractic Physician
- Ron Venters, Ph.D. Duke University NMR Center
- Dan Tracey Jr., Ph.D. Director of Molecular Pain Signaling Laboratory Duke Medical Center
- Sol Orwell Editor, Examine.com
- Robb Wolf Author, The Paleo Solution
- Chris Highcock Conditioning Research
- Bret Contreras Strength and Conditioning Research
- Chris Beardsley Strength and Conditioning Research
- Ari Kolbeinsson Usability and Interaction Designer